Annual carbon impacts chart
What does this feature do?
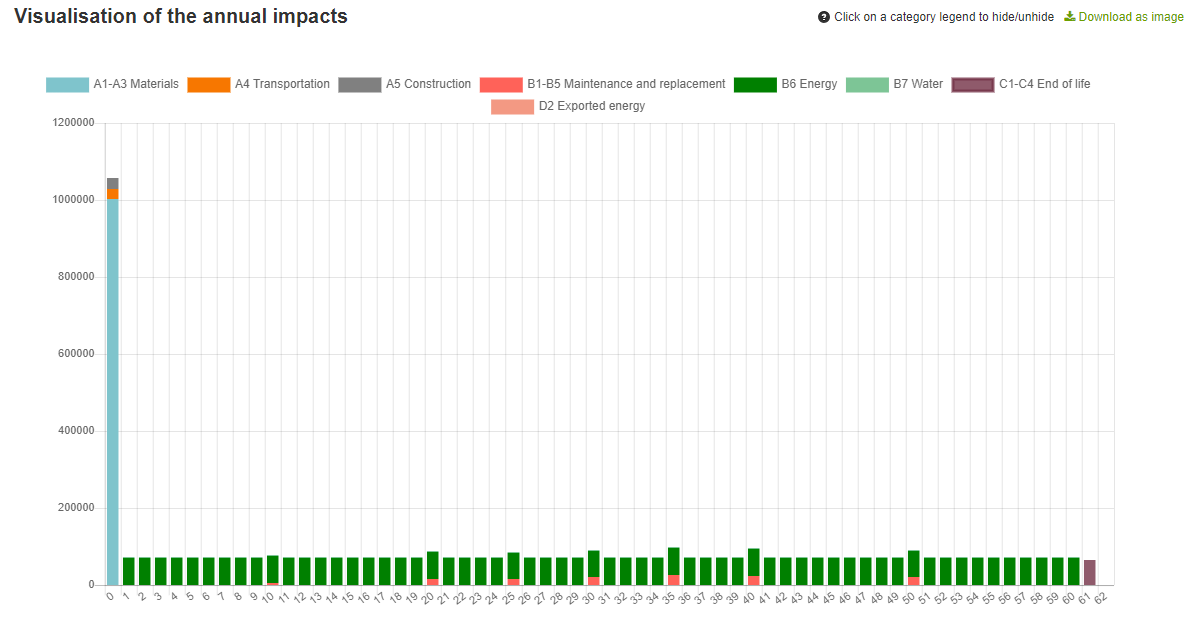
This chart shows the annual carbon impacts over the set calculation period of your project.
How do you use this feature?
Navigate to the results page and scroll almost all the way down, there you will find the annual impacts chart. Most of the time the section with the highest emissions will be the A1-A3 (the materials used in the construction of your project). Transportation (A4) will have a small share and so will the Construction site impacts (A5) if you have filled these in your project.
For the chart below we have used a BREEAM tool as an example (with a calculation period of 60 years), so it might display other life cycle stages which are not reported in other tools. The A1-A3, A4 and A5 emissions will always happen in the beginning of the calculation period of your project. Throughout the calculation period there will be the annual consumption of energy (B6) and water (B7). Furthermore any materials which are replaced (B4-B5) during the life cycle / calculation period of your building will be shown in the B1-B5 category. Any use phase emissions are also attributed to the B1-B5 section. Any annually exported energy (D2) will be displayed next to the energy usage. At last the End of Life emissions will be shown at year 61, when the building is demolished.
All of the graphs can also be download by clicking on the 'Download as image' button.
If you want to reach up on what the different life cycle stages mean, please check the following article: Life Cycle Stages
 Annual impacts chartYou can also take out several factors if you do not want to compare them, for that simply click on the category legend and you will get a different type of graph, in the example below we excluded the A1-A3 emissions to get a clearer overview of the replacements, annual energy and water usage and end of life emissions.
 Annual emissions without A1-A3
For the chart below we have used a BREEAM tool as an example (with a calculation period of 60 years), so it might display other life cycle stages which are not reported in other tools. The A1-A3, A4 and A5 emissions will always happen in the beginning of the calculation period of your project. Throughout the calculation period there will be the annual consumption of energy (B6) and water (B7). Furthermore any materials which are replaced (B4-B5) during the life cycle / calculation period of your building will be shown in the B1-B5 category. Any use phase emissions are also attributed to the B1-B5 section. Any annually exported energy (D2) will be displayed next to the energy usage. At last the End of Life emissions will be shown at year 61, when the building is demolished.
All of the graphs can also be download by clicking on the 'Download as image' button.
If you want to reach up on what the different life cycle stages mean, please check the following article: Life Cycle Stages
Is this feature available to me?
The annual impact charts are included in all Expert package licenses
Related Articles
Carbon Designer
View our Carbon Designer webinar here. What does this feature do? The Carbon Designer tool allows very quick baseline building creation with minimal knowledge about the project and allows optioneering choices and their impacts easily. The Carbon ...Bubble chart
What does this feature do?Bubble charts shows bubbles relative to life-cycle impacts of resource types and sub-types. Same type (e.g. concrete) has same colour, with different sub-types in different bubbles. Types can be disabled from the graph. The ...Carbon reduction webinar and articles
Webinar on Reducing whole building carbon emissions Check out our webinar on '10 ways to reduce Whole Building carbon emissions' here. How to cut the embodied carbon of your building design In this article, we talk about the 10 design commandments ...Carbon Heroes Benchmarks
What does this feature do?The Carbon Heroes Benchmark gives you an unique benchmark analysis from over a thousand buildings which have used One Click LCA to record their life cycle analysis. How do you use this feature? Preconditions: The project ...Biogenic carbon
What is a biogenic carbon? Biogenic carbon is the carbon that is stored in biological materials, such as plants or soil. Carbon accumulates in plants through the process of photosynthesis and therefore bio-based products can contribute to reduce the ...